 VirtualCardx
Enable WordPress Debug Mode to Fix Errors
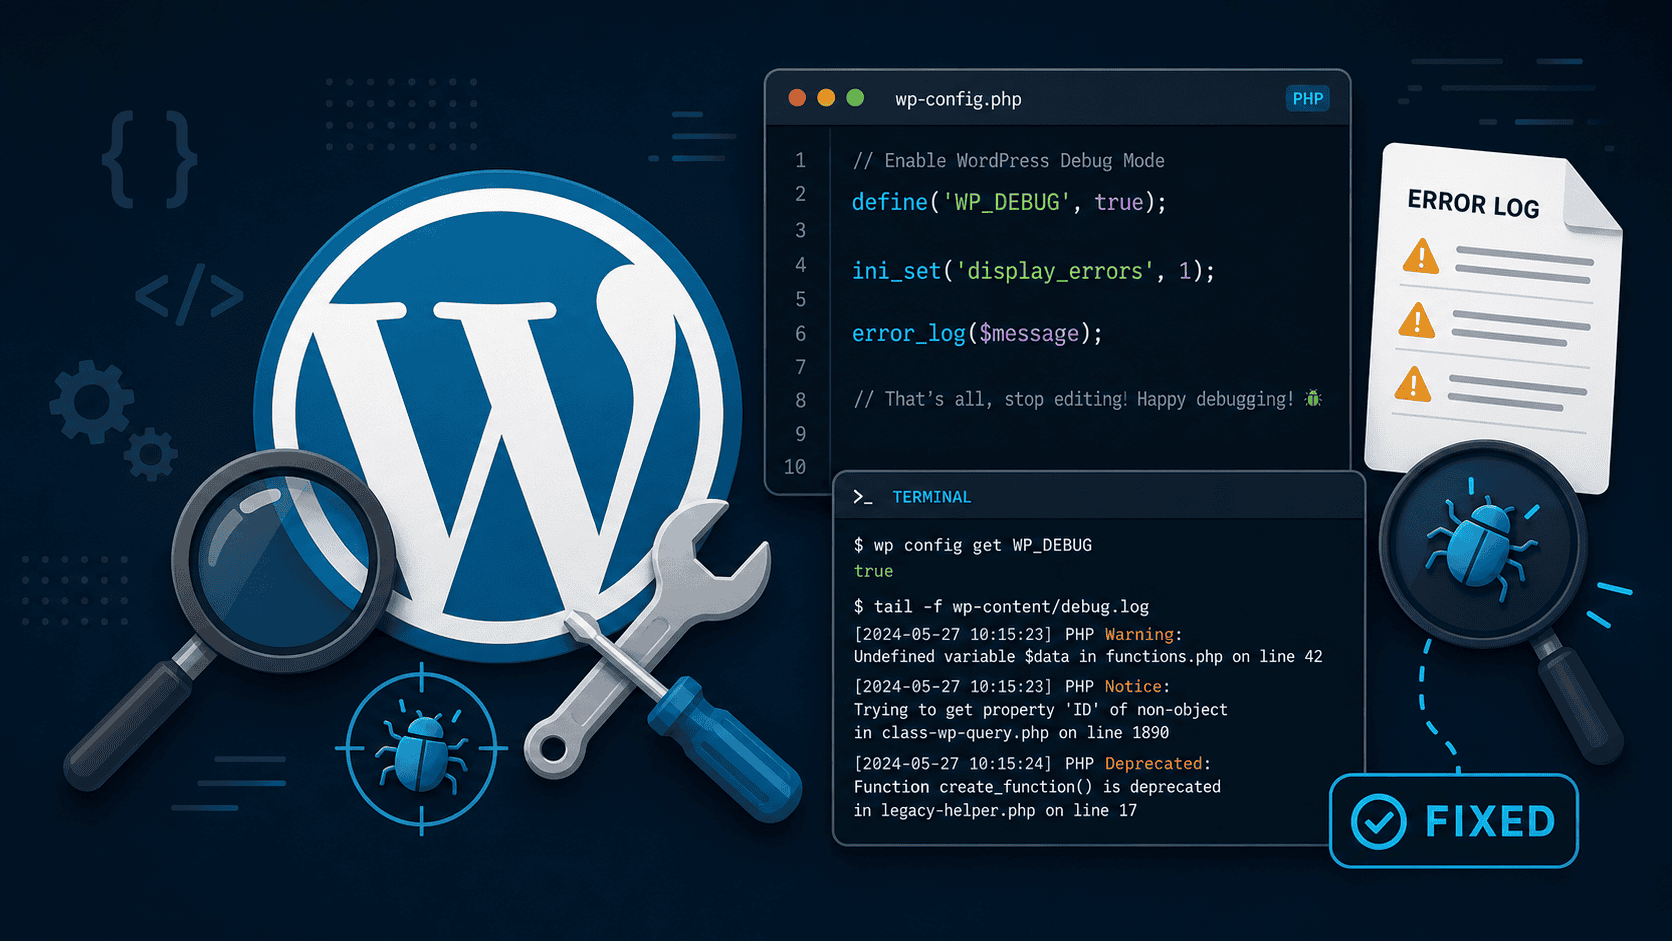
How to Enable WordPress Debug Mode to Troubleshoot Errors
Last week I helped a friend troubleshoot his foreign-trade independent site. After installing a new credit card payment plugin, the front end went completely white - he couldn't even access the WordPress admin panel. Many beginners panic at a "WordPress white screen" or "HTTP 500 Internal Server Error" and immediately nuke the database and reinstall, which is completely unnecessary. Problems caused by code conflicts or plugin incompatibility can usually be pinpointed to the exact file and line within 3 minutes once you enable WordPress's built-in debug mode. Drawing on my daily experience running and developing payment sites, here's how to do it.
Step 1: Locate wp-config.php in Your Site Root
Whether you use SiteGround, BlueHost, or a VPS on AWS or Alibaba Cloud, the core config file for every WordPress site is wp-config.php. I usually work through the BT (BaoTa) panel; if you're on shared hosting, connect via FTP (e.g., FileZilla).
Go to your site root (usually public_html or wwwroot), find wp-config.php, and right-click to edit it.
Step 2: Replace the WP_DEBUG Constants
Scroll down to find the line define( 'WP_DEBUG', false );. Many tutorials just tell you to flip false to true, but in real B2B foreign-trade site operations, I strongly recommend this complete debug combination:
- WP_DEBUG: the master switch for debug mode.
- WP_DEBUG_LOG: writes all error messages to a log file instead of displaying them on the page.
- WP_DEBUG_DISPLAY: disables on-screen error display, keeping customers from seeing garbled output or exposed server paths.
You can copy the block below and replace the original line:
define( 'WP_DEBUG', true );

define( 'WP_DEBUG_LOG', true );

define( 'WP_DEBUG_DISPLAY', false );
After saving, WordPress's debug engine is quietly working in the background.
Why Log to a File Instead of Displaying Errors?
This comes down to security vs. efficiency. If you only set define( 'WP_DEBUG', true );, errors print directly into the page body. That causes two fatal problems: first, overseas customers browsing your site will see a pile of PHP errors, destroying trust; second, error messages expose your server's absolute paths, handing hackers an opening.
Combined with WP_DEBUG_LOG, errors are hidden and silently written to the log. Based on the hundreds of tickets I've handled, the log-based approach cuts the average time to identify a "plugin conflict" from 2 hours to under 10 minutes. Especially when debugging complex WooCommerce virtual-credit-card payment gateway integration failures, the log captures the full API request breakpoints.
Step 3: Read debug.log to Find the Culprit
After editing, refresh the page that was erroring. Then go back to your site root and enter the wp-content folder. You'll see a new file called debug.log.
Download and open it - the newest errors are usually at the bottom. In my friend's case, the last line read: PHP Fatal error: Uncaught Error: Call to undefined function wc_get_order() in /public_html/wp-content/plugins/stripe-gateway/includes/class-wc-gateway-stripe.php on line 45.
This line is extremely informative:
Fatal errortells us this is a fatal error causing the white screen.plugins/stripe-gateway/...pinpoints the Stripe payment plugin as the culprit.on line 45shows exactly which line failed (because he'd shortcut by calling an order function without loading WooCommerce's core files).
At this point the fix is obvious: deactivate the offending plugin, or contact the developer to fix that line. Problem solved.
A Few Practical Tips
- Always turn debug mode off after troubleshooting: once the site is live, set
WP_DEBUGback tofalse, otherwisedebug.loggrows with every visitor, eventually slowing database reads and server response times - or filling the disk entirely. - Make good use of the Query Monitor plugin: for deeper performance analysis (e.g., which SQL queries slow down pages), install the free Query Monitor plugin. It mounts on the WordPress admin toolbar and shows all API requests, PHP errors, and database query times right in the front end - a killer tool for optimizing foreign-trade site speed.
- Clean up old logs regularly: during development,
debug.logcan easily exceed tens of MB. I clear it weekly to keep the dev environment lightweight.
WordPress is a very transparent CMS. Once you master proper troubleshooting, you'll handle anything with ease - whether it's integrating a complex cross-border payment gateway or deeply customizing a B2B inquiry form. Next time your site throws an error or white-screens, don't panic: go read debug.log and see what it's trying to tell you.
2026 verification note
Recheck this procedure against the linked primary documentation and the live configuration before applying it. Product limits, plugin settings, dashboard labels, server paths, and commands change over time. Take a backup, test in staging where possible, validate configuration syntax before reload/restart, and verify the resulting HTTP status, canonical URL, logs, and user-visible behavior. Do not treat a successful command or a third-party tool score as proof that the underlying SEO, security, or availability issue is resolved.
Use least-privilege credentials, keep secrets out of repositories and logs, and preserve a rollback plan. For search changes, observe Search Console data over a normal reporting period rather than repeatedly requesting indexing.